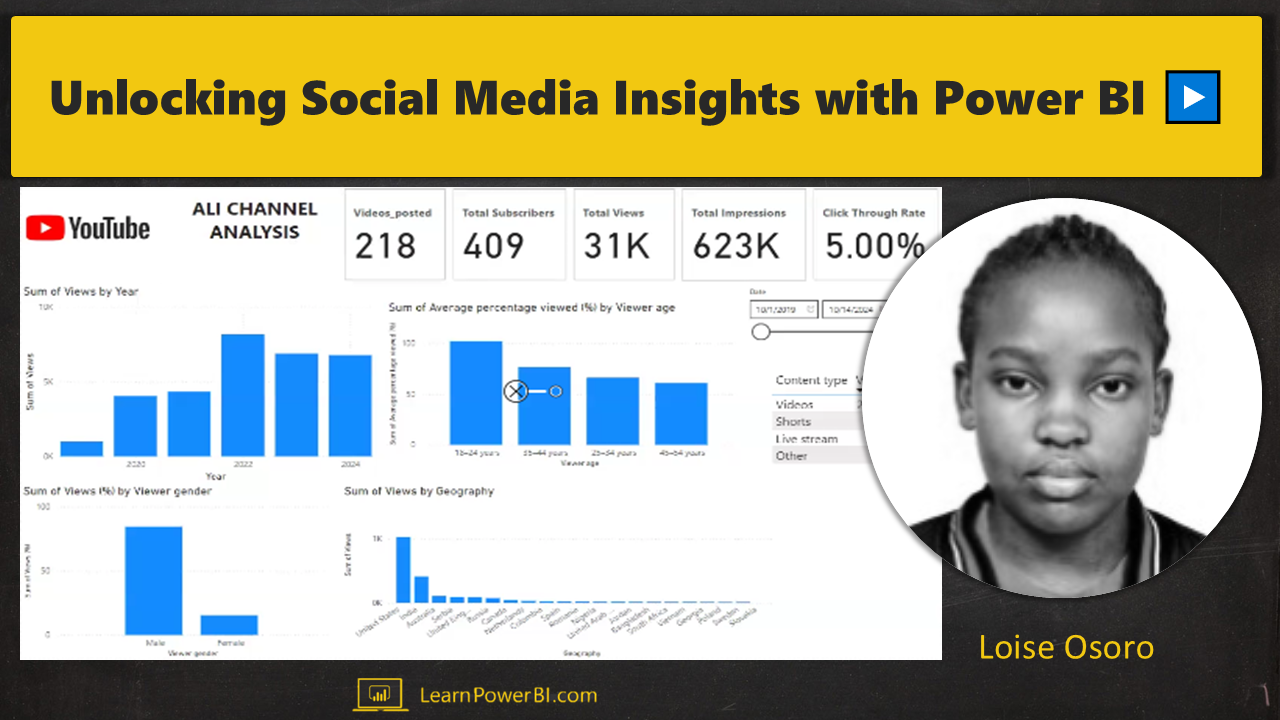
Social Media Insights with Power BI: A YouTube Channel Analysis ▶️
In this presentation, Loise Osoro, a LearnPowerBI Member, demonstrates how Power BI can transform raw social media data into actionable insights. Using a YouTube channel as a case study, Loise highlights key metrics to reveal:
Content Performance: Discover which types of content—videos, shorts, or live streams—engage viewers the most.
Audience Insights: Understand the demographics, preferences, and geographical distribution of viewers to refine content strategies.
Practical Recommendations: See how adjustments like optimizing thumbnails and focusing on video content can boost click-through rates and drive engagement.
This presentation is a compelling example of how Power BI can empower creators and businesses to make data-driven decisions for social media success.
Click below 👇 to watch Loise Osoro, a LearnPowerBI Member, deliver her full presentation on unlocking social media insights and optimizing YouTube channel performance using Power BI.
Click below 👇 to join our LearnPowerBI Program and start building your own Dashboards 📊

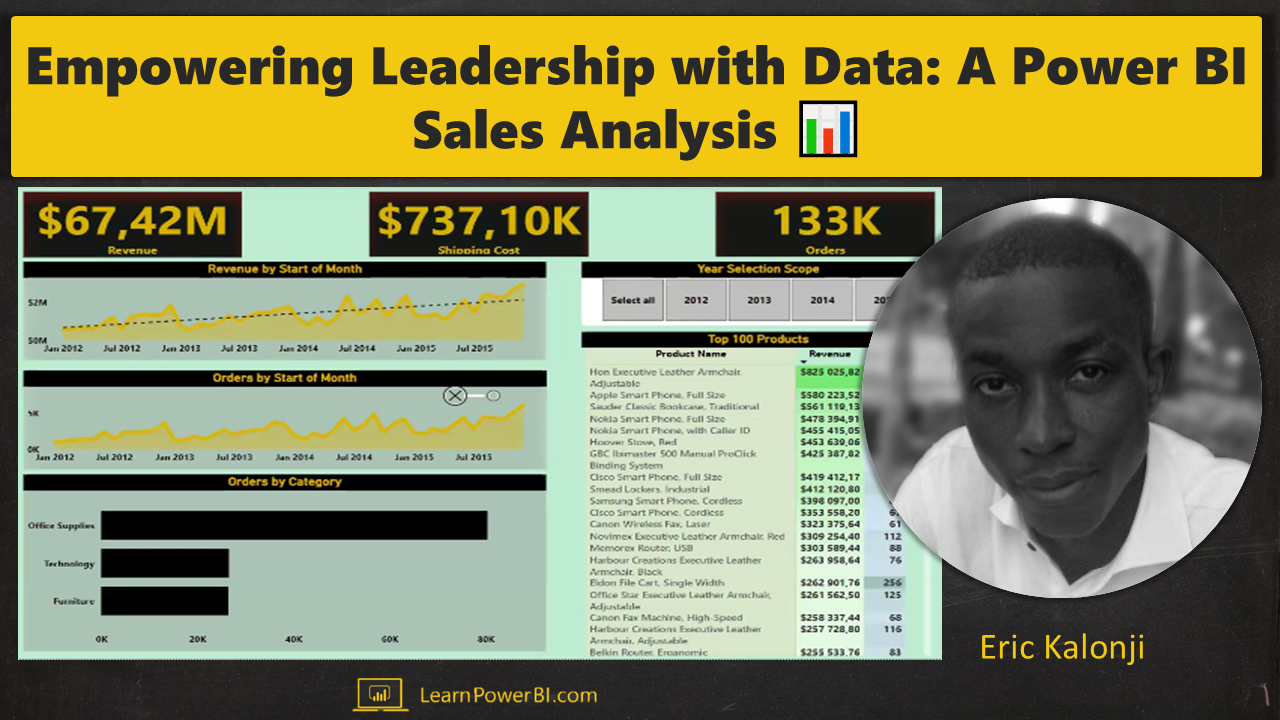
Empowering Leadership with Data: A Power BI Sales Analysis 📊
What does it take for a business to navigate its course successfully, much like steering a ship through challenging waters? In this presentation, Eric Kalonji, a LearnPowerBI Member, uses his unique analogy of navigating a ship 🚢 over troubled waters 🌊 to highlight the importance of leveraging Power BI 📊 for effective business decision-making.
With a focus on sales trends, Eric explores how Power BI can provide:
Visibility into Product Performance: Discover which products perform best across categories and locations, enabling data-driven inventory and marketing decisions.
Customer Insights: Identify top customers, detect trends, and address engagement gaps to enhance customer retention and loyalty programs.
Actionable Sales Trends: Use dynamic visuals to track sales patterns, highlight growth opportunities, and anticipate potential challenges.
Through relatable storytelling and clear data visualizations, Eric demonstrates how Power BI can equip leadership with the insight and foresight needed to drive growth and ensure operational excellence.
Click below 👇 to watch Eric Kalonji, a LearnPowerBI Member, deliver his full presentation on empowering company leadership with actionable sales insights using Power BI.
Click below 👇 to join our LearnPowerBI Program and start building your own Dashboards 📊
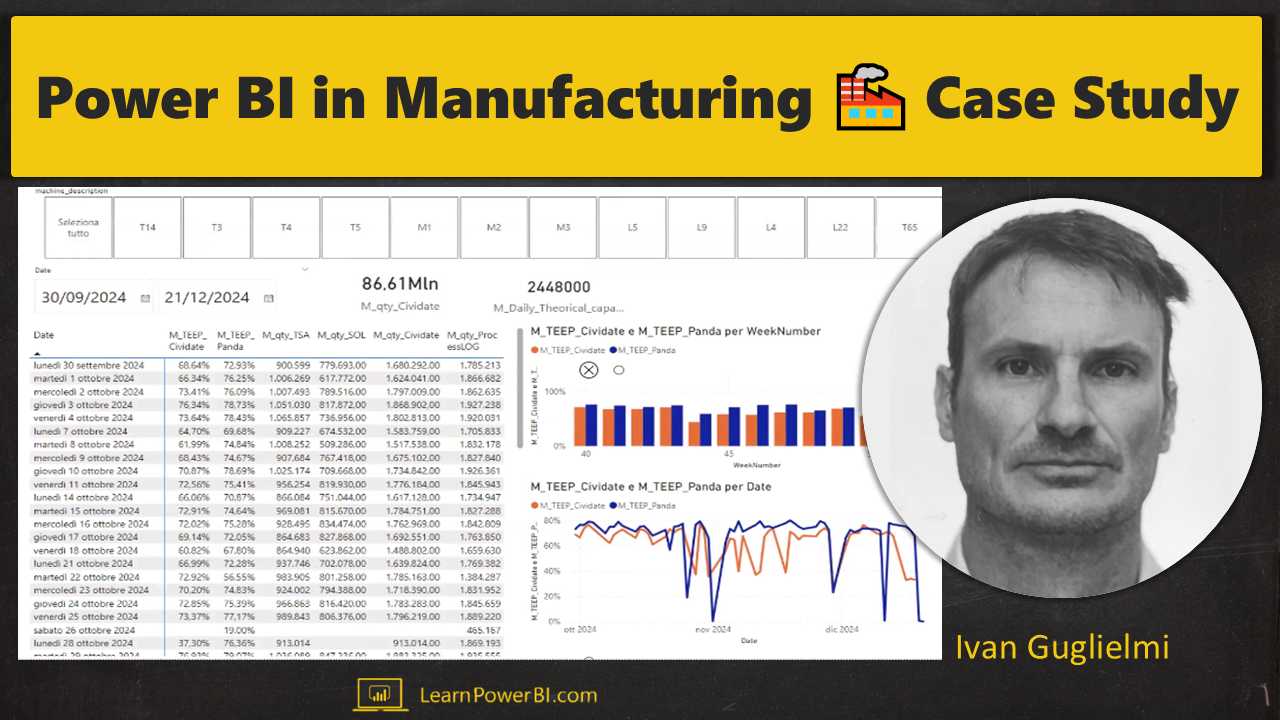
Building Trust in Your Data: Power BI in Manufacturing 🏭 Case Study
How do you bridge the gap between impressive Power BI dashboards and reliable, actionable insights? Ivan Guglielmi, a LearnPowerBI Member and a manufacturing professional 🏭 with over 20 years of experience, shares his journey of using Power BI 📊 to validate critical production data for his company. Here’s what you can expect from his presentation:
Real-world Problem Solving: Ivan demonstrates how he identified and addressed data discrepancies in a manufacturing environment to ensure accuracy and reliability.
Practical Use of Power BI: As a beginner Power BI user, Ivan shows how he applied the tools and techniques learned to create meaningful dashboards.
Key Lessons for Beginners: Learn how to start small, focus on the basics, and gradually build skills to create impactful solutions.
Business Context: See how Power BI was used to validate systems, improve real-time monitoring, and drive decision-making across multiple global production sites.
Ivan’s story is a relatable and inspiring example of starting your Power BI journey, emphasizing the importance of aligning your technical skills with real business challenges.
Click below 👇 to watch Ivan Guglielmi, a LearnPowerBI Member, deliver his full presentation on building trust in manufacturing data with Power BI.
Click below 👇 to join our LearnPowerBI Program and start building your own Dashboards 📊
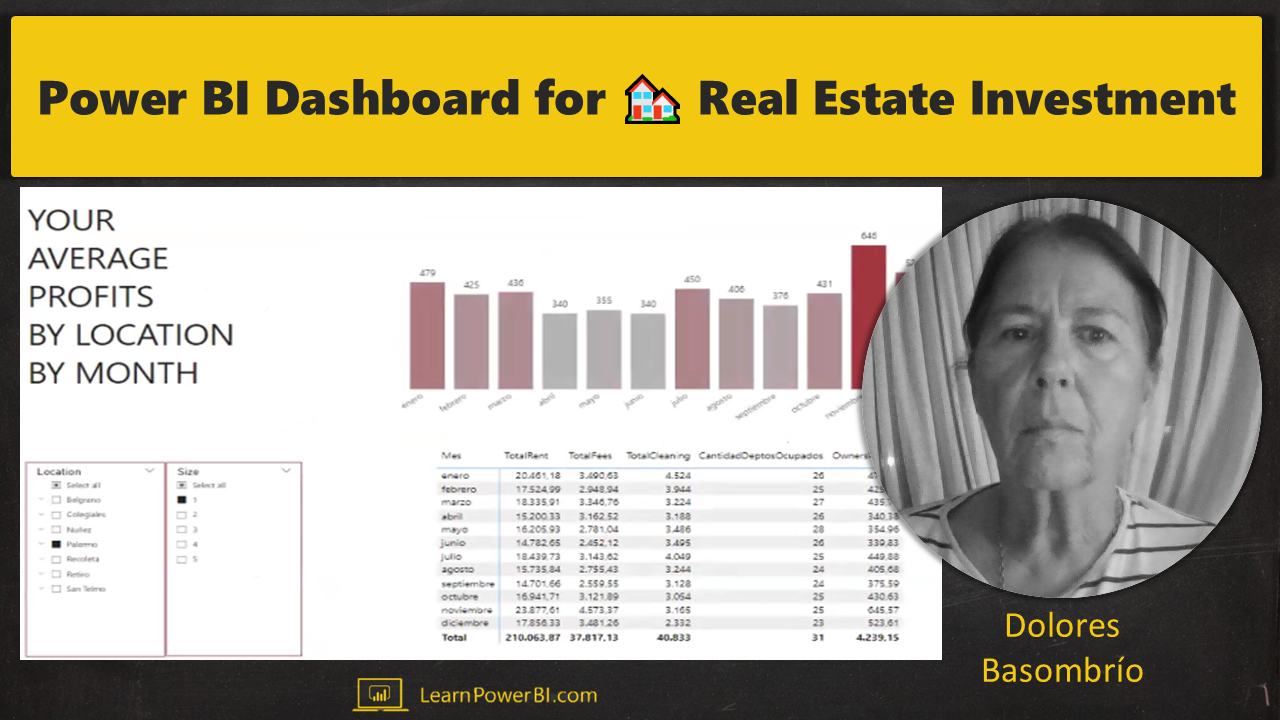
Unlocking the Power of Data: Power BI Dashboard for 🏘️ Real Estate Investment
Real estate has long been one of the most reliable ways to build wealth 🏡, earn passive income 💰, and achieve financial freedom 🌌. Whether you're looking to grow your net worth, retire early, or enjoy the perks of an extra income stream, real estate offers exciting opportunities.
But with great rewards come challenges. The risk of choosing the wrong property or location can lead to significant losses, leaving many potential investors feeling hesitant. 🚫
This is where data & Power BI 📊 become your greatest ally.
With tools like Power BI, you can make informed, data-driven decisions to minimize risks and maximize returns. Dolores, one of our esteemed members, recently showcased an incredible Power BI dashboard that:
Takes the guesswork out of real estate investing
Focuses on analyzing Airbnb data
Provides actionable insights that apply to all types of real estate investments.
Click below 👇 to watch Dolores Basombrío, a LearnPowerBI Member, deliver her full presentation on unlocking real estate investment success with Power BI.
In the above presentation, she covers:
Turning Data Into Investment Gold
How do you choose the right area to invest in? This is a critical question for real estate investors, and Dolores’ dashboard provides a clear answer by analyzing Airbnb data at the neighborhood level. It uncovers patterns that help you steer clear of risky investments and identify high-potential areas.
Key insights include:
Avoiding risky areas: Some neighborhoods may boast high rental prices but have low occupancy rates, making them unreliable.
Finding hidden gems: Other neighborhoods with moderate rental prices may enjoy consistently high occupancy rates, offering steady income throughout the year. 🌟
By using this data, you can focus on areas that provide long-term, reliable returns instead of chasing short-term trends.
Finding the Sweet Spot for Bookings
When do people book the most? One of the most surprising and actionable insights from Dolores’ analysis is this:
Tuesday is the most popular day for Airbnb bookings. 📅
Here’s why this matters:
Targeted marketing: If you’re managing a short-term rental, focusing your outreach and social media efforts on Tuesdays can significantly boost visibility. 📲
Running ads effectively: Ads placed on Tuesdays are likely to reach more people actively searching for rentals, increasing your chances of securing bookings.
This insight alone could transform your Airbnb strategy, keeping your property booked and your income flowing year-round. 💵
Insights for Smarter Property Management
Dolores’ dashboard goes beyond helping you choose the right property. It also provides actionable insights for running your Airbnb or rental business more effectively.
Additional insights include:
Seasonal trends: Understanding peak and off-peak seasons helps you adjust pricing and marketing strategies accordingly. 🌐
Booking behaviors: Knowing when and how guests prefer to book allows you to optimize your listings and promotions.
Maximizing occupancy: Identifying patterns in customer demand ensures your property is generating income consistently. 🏡
These insights empower property owners to make better decisions, not just at the investment stage but throughout the lifecycle of their property.
Scroll up 👆 to watch the Full Video ▶️ by Dolores Basombrío
Click below 👇 to join our LearnPowerBI Program and start building your own Dashboards 📊

Scaling Power BI Analytics 📊 for Sales, Marketing, Supply Chain
Are you ready to be inspired by a real-world Power BI success story? In this recording of our LinkedIn Live session, Manuel Fuentes, Director of Marketing, Pricing & Business Analytics at Labelmaster, shared his incredible journey of implementing and scaling Power BI within his organization.
Manuel was one of the earliest members of the LearnPowerBI program, joining back in 2018. Since then, he’s transformed Labelmaster’s approach to data and analytics, creating a powerhouse team that drives impactful decisions across sales, marketing, supply chain, and more.
During this session, Manuel delved into:
✔️ The challenges and milestones of rolling out Power BI across departments.
✔️ How his team has used analytics to increase margins and operational efficiency.
✔️ Exciting innovations in data, BI, and AI at Labelmaster.
And there’s more! Manuel also revealed an exciting opportunity to join his team. If you’re passionate about data and analytics, this could be your chance to take your career to the next level!
🎥 Don’t just take our word for it—watch the full session to hear Manuel’s story firsthand and discover what’s possible with Power BI.
➔ Connect or Follow Manuel Fuentes on LinkedIn
➔ Connect or Follow Nidhi Johnson on LinkedIn
➔ Apply for Open Position at Labelmaster: Marketing Data Analytics Manager
👉 Ready to master Power BI and create impact like Manuel? Join the LearnPowerBI program and start your journey today. Click here to learn more and apply.

Driving Growth for Dental Clinics 🦷 with Power BI 📊
Click Play above 👆 to watch video
Interview with:
Dr. Daniel Klauer / Owner / TMJ & Sleep Therapy Center Indiana
❝Without a doubt, I'd have zero hesitation to recommending Avi. You'll get immense value, and you'll genuinely enjoy working with him❞
Working with data can be a love-hate experience.
There's so much valuable insight you can gather, but for us, it used to be quite challenging. We were stuck in Excel, constantly sorting pivot tables, and dealing with errors that would cause everything to fall apart. It was a real pain point.
But working with Avi has been like hiring a perpetual employee who takes care of all our reporting needs without the hassle of managing another person.
Now, I can simply log in on my phone—the app is awesome, better than I expected. I even showed it to a friend who's an orthodontist, and it's just so cool to be able to look at and share data on a moment's notice.
If you're looking to implement Power BI, I would undoubtedly recommend Avi.
It's not just about making charts; it's about understanding the business.
The other two companies I spoke with didn't understand what we do or why. They were just going to take the data, make a table, and be done. Avi goes deeper. He added elements to our Power BI system that we hadn't even thought of but now realize we needed.
Without a doubt, I'd have zero hesitation to recommending Avi. You'll get immense value, and you'll genuinely enjoy working with him.❞
Full Interview with Dr. Daniel Klauer
Note: This article is adapted from the original video interview. While it captures the main points and insights, some wording has been modified for clarity and brevity.
Can You Tell Us About Yourself and TMJ Sleep Indiana?
“I am Dr. Daniel Klauer, a dentist who dedicates 100% of my time to treating patients with headaches, migraines, snoring, and sleep apnea. At TMJ Sleep Indiana, my team and I help both adults and children overcome chronic pain and sleep issues, aiming to improve their quality of life.
I've been practicing for over 12 years, and I take pride in the transformative nature of the work we do, from helping couples sleep better together to giving young professionals a chance to reclaim their careers by addressing their sleep and pain problems.”
What Does Growth Mean to You Beyond Just Sales? 🌱
“Growth for me isn’t just about numbers. It's a threefold concept: personal, professional, and patient-related. On a personal level, growth is about setting an example for my family, being a good husband and father, and teaching my children the value of ethical, honest work.
Professionally, I want to create a positive culture within my clinic—a place where my team members feel respected, valued, and passionate about their work. Growth means seeing my team thrive both personally and professionally, even if it means some members outgrow the clinic and move on to greater opportunities.
From a business perspective, growth means finding and serving the right patients—those who can benefit most from what we offer at TMJ Sleep Indiana. It’s important to me to get the right people in front of the right practitioners, and to be honest with patients about whether my clinic is the right fit for them.”
What Challenges 🛑 Did You Face with Data and Reporting?
“Like many medical professionals, I have a love-hate relationship with data. I acknowledge the immense potential that data holds but point out the challenges in managing it efficiently, especially for more specialized practices like mine. Unlike general dental practices, which often have streamlined analytics tools, TMJ Sleep Indiana operates in a gray area between dental and medical practices, using a mix of dental software, medical records systems, and tools like HubSpot for marketing.
Previously, the clinic relied on Excel spreadsheets to compile and analyze data, which often led to frustrating errors and inefficiencies. A small mistake could disrupt the entire reporting system, making it difficult to get accurate, up-to-date insights into the business. This was one of the major pain points that I sought to address by improving our data analytics capabilities.”
Why Did You Choose to Work with Avi Singh for Power BI Consulting? 🤝🏼
“Working with Avi Singh felt genuine from the start. Avi's curiosity and interest in understanding the needs of TMJ Sleep Indiana were evident early on. I appreciated Avi's candid approach and willingness to honestly assess whether he could add value to our operations.
This honesty and attention to detail were what set Avi apart from other consulting firms. The other firms I consulted with were primarily focused on generating reports without taking the time to understand the nuances of my business. Avi, on the other hand, worked to integrate himself into the business, asking insightful questions and even offering suggestions that we hadn’t initially considered.”
How Has Data Reporting Changed Your Business? 💡
“One of the standout benefits that Avi's Power BI solutions provided was clarity—particularly in times of doubt. I recall a recent instance where the team perceived that our patient intake numbers were down. Thanks to the new reporting, we were able to see that while some cases were delayed due to patient readiness, the overall patient flow was actually on track.
This ability to distinguish perception from reality has been invaluable. The reporting tools have given us an objective outlook, helping us track patient progress and make informed decisions about where to allocate our energy and resources. I also feel that we are just scratching the surface with the capabilities of the Power BI solution, and even the first version of the product exceeded my expectations.”
How Has Improved Data Reporting 📊 Impacted Your Team Meetings and Workflow?
“The improved data reporting has had a significant impact on how our team operates. For instance, Jillian, a team member, now starts meetings by sharing key data points—for instance, which referral sources have increased or decreased. This kind of insight has allowed us to invest time and resources in the right places and even take action, such as visiting specific areas to thank referring offices.
I described the integration of Power BI as akin to hiring a perpetual employee who manages data without adding extra strain on the team. My team feels empowered with better data insights, and I enjoy the convenience of being able to pull up business analytics from my phone and share insights on the go.”
Did You Have Any Hesitations 🤔 About Adopting New Technology?
“Reflecting on the initial decision to invest in data analytics, I trusted the advice of a business confidant, who pointed out the inefficiencies in our existing system and recommended automating data processes. This trust enabled me to move quickly and confidently in adopting a new platform. Working with Avi further reinforced this trust, as Avi’s approach mirrored my own philosophy: building genuine relationships before diving into the details.
I emphasized the importance of collaboration—not just outsourcing work. Getting the most value from Avi's consulting required active participation, sharing feedback, and working as a partner rather than just handing over tasks.”
Would You Recommend Avi Singh for Power BI Consulting? 👍
“I would wholeheartedly recommend Avi Singh's services. The value, professionalism, and care that Avi brought to the project were exceptional. The true power of the consulting engagement went beyond just building dashboards. Avi took the time to understand the business and provided features that we hadn’t even realized we needed. I emphasized that Avi's approach was about creating the right solutions for the right clients—not just taking every project that came along.
The personal touch, ease of communication, and commitment to efficiency were also highlights for my team and me. Jillian, in particular, found the collaboration enjoyable, and we both appreciated Avi's proactive follow-up and effective reporting practices.”
What Are Your Final Thoughts on Investing in Business Analytics? 🌟
“I concluded by reiterating the importance of investing in your business and choosing trusted advisors. I believe in being the kind of client you would want in your own practice—someone open, collaborative, and willing to trust the expertise of the professionals you work with. Working with Avi Singh and adopting Power BI has not only transformed our data reporting but also helped strengthen the culture of continuous growth and improvement at TMJ Sleep Indiana.”
Scroll up 👆 to watch the Full Video Interview ▶️ with Dr. Daniel Klauer
Click below 👇 to get Power BI Consulting help for your business.

How Power BI 📊 Transformed Sales Tracking for Law Firm ⚖️
Click Play above 👆 to watch video
Interview with:
Moshe Amsel / CEO / Profit with Law
Note: This article is adapted from the original video interview. While it captures the main points and insights, some wording has been modified for clarity and brevity.
Why the Sales Engine is Vital for Law Firms' Growth ⚖️
“For any business, the name of the game is bringing in clients. We always look at that revenue number as the barometer of how we’re doing. That’s really what keeps the engine running—getting clients in the door.”
The Challenges 🚧 Law Firms Face in Motivating Sales Teams
“Law Firms are unique in that they can’t pay commissions to salespeople the way other industries can. This means they often have confusing bonus structures that make it hard for salespeople to know what they need to do to succeed.
In one particular case, the firm had a team-level bonus system where it didn’t matter if one person made $5 and another made $1—they both got the same payout. This motivated the team as a whole but failed to motivate individuals.”
Tracking Sales Progress Before Power BI 📝
“Before we worked together, the firm relied on spreadsheets to track sales, and much of the process was manual. While some steps were automated, they still had to manually update the details of each sale. At the end of each month, bonuses were calculated using these spreadsheets, making the entire process cumbersome and time-consuming.”
The Problems with Manual Tracking ⚠️
“First of all, everyone on the sales team had access to the sheet, which always left room for human or even malicious error.
There was also no easy visual way to see how an individual salesperson was doing. Each salesperson had to filter through the entire sheet to find their numbers, which was cumbersome.
The old structure wasn’t individualistic, so they only cared whether the team hit a fixed number—once they did, everyone got the same bonus. This actually became demotivating over time.”
🤔 Do I Really Need Power BI? Why Existing Tools Aren't Enough
“As a Fractional CFO, I use various tools for reporting on financials, but they fall short when things get complicated, like with convoluted sales bonuses or marketing analysis. We needed a more customized solution—one that went beyond what out-of-the-box tools like QuickBooks could provide.
The challenge was how to create a visual tool that could help the firm make better business decisions while being efficient and cost-effective.”
Power BI Brings Clarity 💡 and Motivation to Sales Performance 🚀
“You and your team used Power BI to create an incredible tool. We now have real-time, up-to-date information available to the sales team. Just today, I was in a meeting where we used the tool to analyze sales performance.
One salesperson is only $20,000 away from unlocking the highest bonus—she’s motivated because she can see exactly how she’s doing.
Another salesperson, meanwhile, hasn’t even hit the minimum threshold yet. This visibility has been a game-changer; it motivates the right behaviors and will help save money on bonuses that were previously being paid to people who didn’t deserve them.”
From Hours ⏳ to Minutes: Automating Bonus Calculations
“The dashboard has automated the bonus calculation process. What used to take three to four hours each month now takes just five minutes. All the data is live, and after the last day of the month, everything is calculated automatically. It’s a huge time saver and has taken away a dreaded monthly task.”
The Agile Approach 🔄 to Building the Dashboard
“The way we worked together was ideal for me. I prefer to think on my feet, make changes on the fly, and get something into our hands to test.
Spending weeks at a drawing board isn’t my style. When I reached out to you, we had a tight deadline—11 days to get a dashboard in place. We had a working version by then, and a final version a few weeks later. The agile approach made that possible.”
Future Possibilities with Power BI 📊
“One area I’d love to explore is automating the separation of personal and business expenses. Currently, we have to do this manually, but if we could build a Power BI dashboard that identifies these categories automatically, it would simplify our process immensely.
Another idea is to better track marketing campaigns, especially linking spend to revenue generated over different time periods—something that out-of-the-box tools just can’t do effectively.”
Do You Recommend Power BI Consulting with Avi? 🤝🏼
“Absolutely! Even before working with you, I knew about your expertise in Power BI through our mutual business mentor. When I faced a tight deadline, I immediately thought of you. The work you’ve done has truly exceeded my expectations, and I see a big opportunity for us to keep collaborating. For anyone needing dashboards in Power BI, I highly recommend Avi and his team.”
Scroll up 👆 to watch the Full Video Interview ▶️ with Moshe Amsel.
Click below 👇 to get Power BI Consulting help for your business.

Small Business: Track Your Sales Targets 🎯 and Bonus using Microsoft Power BI 📊
Click Play above 👆 to watch video
If you’re a Small Business Owner with a sales team of 5 to 10 people, you probably already have targets 🎯 and bonuses 💲 to keep them motivated. But if your team can’t easily track their progress, it doesn’t work as well as it should.
In this article, I’ll show you how to keep your sales team motivated and pushing toward their goals by using a Microsoft Power BI report that helps them see exactly where they stand against their targets and their path to unlocking their next bonus!
Why Tracking Sales Targets and Bonuses Matters
Salespeople are often driven by clear goals and the promise of bonuses. As a Small Business Owner, you likely have individual and team goals with multiple tiers and bonus levels. However, if you’re still tracking these goals using a jumble of Excel sheets or Google Sheets, it might not be as effective as you’d like.
That’s where Microsoft Power BI comes in. Power BI can provide a beautiful, easy-to-use report that automatically refreshes and always shows your team exactly where they stand. Let’s explore how this can help your business.
Benefits of Using Power BI for Sales Tracking
Here are some key reasons why Power BI can transform the way you track sales targets and bonuses:
Clear and Accessible Reporting: Sales teams can access their reports from any device—laptop, tablet, or mobile—making it easy to check progress wherever they are.
Automated Updates: The reports automatically refresh, showing real-time progress, which keeps your team engaged and focused on hitting their goals.
Motivation Through Visualization: Sales teams can see visually how close they are to the next bonus tier, keeping them motivated to close more deals and shrink that gap.
Power BI Sales Targets Walkthrough
Here’s a quick overview of the features and reports I cover in the video to help you manage your sales targets and bonuses effectively:
Team Goals Overview: At the top of the report, you can see the team goals for the selected month, including different tiers, targets, and bonuses. Management can adjust these goals at any time, whether to push the team higher or respond to market conditions.
Visual Progress Against Goals: A graph shows your team’s progress against their goals, and a table provides detailed numbers. You can see how much revenue has been achieved, what tier has been unlocked, and the total bonus earned so far.
Motivation Through Gap Visualization: The report highlights the gap between the current status and the next bonus tier, which motivates salespeople to close the gap as they complete more sales.
Individual Goals Tracking: For each team member, you can track individual progress against their personal goals, with a visual display showing which tier they’ve achieved and the bonus they’ve unlocked. It’s a powerful way to help each salesperson stay focused on their targets.
Performance Breakdown by Team Member: The report includes a table that shows how each team member is performing. You can identify your top performers, like Janice and Rolf, who have hit the highest bonus tiers, as well as those who may need more support to reach their targets.
Sales Trends and Projections: A trend line helps you track where the team is headed based on current performance, allowing you to forecast whether they’ll meet their targets by the end of the month. This is particularly useful for sales leaders to keep an eye on progress and adjust strategies if needed.
Scroll up 👆 to watch the Full Video ▶️, to see the full Power BI Sales Tracking Report walkthrough in action.
Interactive Power BI Sales Tracking Report
About the Author
I’m Avi Singh, a Power BI Microsoft MVP based in Seattle, WA, and through my consulting services at LearnPowerBI.com, I’ve helped companies of all sizes. Now, my passion is helping small businesses grow their sales by using data analytics.
Need Power BI help? Just Contact Me

Small Business: Know Your Customer Demographics 👨👩👦 using Microsoft Power BI 📊
Click Play above 👆 to watch video
As a small business owner, you’re already investing 💲💲💲 in marketing and advertising to grow your business. But did you know that 50% of that money is often wasted? The key is figuring out which 50% is ineffective.
This is where Microsoft Power BI comes in. By understanding your customer demographics, you can optimize your marketing spend and focus your efforts on the right locations and audience.
Why Customer Demographics Matter
Knowing your customer demographics is essential for making informed decisions that drive your marketing success. By using Power BI to analyze data such as location, age, gender, and more, you can fine-tune your marketing strategies, by knowing:
Who to Target: Identifying key customer segments, such as age groups or gender, allows you to focus your marketing on the most engaged audiences.
Where to Target: Analyzing customer location helps you prioritize regions with high engagement and profitability, ensuring your advertising reaches the right areas.
How to Target: Understanding the preferences and behaviors of different demographic groups allows you to craft personalized campaigns that resonate with your audience.
By leveraging demographic insights, you can make smarter, data-driven decisions that help reduce wasted spending and maximize the impact of your marketing efforts.
Power BI Customer Demographics Walkthrough
Here’s a quick look at the key reports I demonstrate in the video, showing you how Power BI can provide detailed insights into your customer demographics:
Visualize Customer Locations: Easily map out where your customers are located, giving you a clear view of geographical distribution.
Sales Insights by Location: Dive deeper into customer locations by adding sales metrics like Sales Count, Sales Amount, and Customer Count, represented visually with bubble sizes for quick comparison.
Demographics Breakdown by Location: Go a step further by analyzing your customer locations with additional layers of information, such as gender, products sold, or other key attributes, to tailor your strategies.
Sales Distance Distribution: See how far your customers are willing to travel! Visualize the distribution of your sales by distance—are most of your customers within 5 or 10 miles? Use this data to refine your marketing reach.
High-Value vs. Low-Value Segmentation: Leverage one of the most powerful features in Power BI by segmenting locations and customers into high-value and low-value tiers. This allows you to focus your efforts on your most profitable regions and customers.
In-Depth Customer Attributes Analysis: Analyze your customer base using key demographic attributes like age, gender, occupation, and more. Whether you’re tracking family size, marital status, or any other relevant data for your industry, this report gives you the power to fine-tune your customer insights.
Scroll up 👆 to watch the Full Video ▶️, to see the full Power BI customer demographics walkthrough in action.
Interactive Power BI Customer Demographics Report
Note: Unfortunately as you can see below, embedding this report here is causing an error ❌ in the “Maps” Visuals. This is only a problem when publishing a report publicly. Not an issue when you would be sharing your report privately. I am following up with Microsoft to attempt to investigate this issue
About the Author
I’m Avi Singh, a Power BI Microsoft MVP based in Seattle, WA, and through my consulting services at LearnPowerBI.com, I’ve helped companies of all sizes. Now, my passion is helping small businesses grow their sales by using data analytics.
Need Power BI help? Just Contact Me
![Call for Speakers: Online Power BI Conference [Oct 2024]](https://images.squarespace-cdn.com/content/v1/642a6d0cf3c1736950e19668/1681490176288-QGHMSZKW8A5B1YTPH6A8/Avi_Grand_Gesture_Wide.png)
Call for Speakers: Online Power BI Conference [Oct 2024]
Have you completed a successful Power BI project for a specific Industry/Niche?
Are you willing to share your journey and lessons learned?
And you already know that sharing your story on a stage is a powerful career boost?
Then I would like to invite you to speak at our upcoming Online Power BI Conference.

Power BI Conference for Business Users
[Oct 23-24, 2024]
How This Conference is Different
Most conferences I've been part of are geared towards very technical aspects of Power BI and are aimed at the technical user.
This is conference is unique because it is:
“A Conference for the Business Users,
Created by the Business Users”
We cut out the geek-speak 🤓 and love sharing simple ideas 💡 and explanations ✔️ to help our audience understand how to get results with Power BI 📊.
How Power BI can help you solve your unique business problems in your specific industry?
How should you go about the journey of adopting Power BI within your team/organization?
How can you follow the best practices and avoid common pitfalls on the path of Power BI?
We are Looking for Unique Speakers…
We are looking for unique speakers…for this unique online event.
Do you…

Love Your Work?
Are you someone who loves Power BI? And even more so, love the impact you create by using your Power BI skills?

Live Your Life?
Your life is more than just money or achievement. You make room for the important things in your life - be it taking care of yourself, family time or travel and adventure.

Have A story to Tell?
You have a story to share of transformation using Power BI.
Then we would love 💛 to have you speak at our upcoming online conference to share your Power BI journey and lessons learned. Just click below to fill out the speaker survey 👇
Why You Should Speak?
In this day and age, you can’t just do good work and hope 🤞 to succeed.
You need to:

And our upcoming Online Power BI Conference, is a terrific opportunity take that step towards your success:
What Previous Speakers Have Experienced

Mindy Qi
Calgary, Canada
Presentation: HR Report Automation using Power BI
❝Would Others Even Care about My Work with Power BI?❞
I knew my Power BI work had been valuable for my team. I had helped automate HR Reports using Power BI, and that had improved the work efficiency for our whole team!
But was this something that other people would care about?
Would they find any of this helpful or relevant?
Would they even care?
But the presentation and the feedback from the audience 💛, was basically a testimony that this was valuable! The listeners made me feel that what I did, probably can also make a difference in their work, in their life. And could be significant help to them too.
That was a really amazing feeling and it really boosted my confidence!
I loved sharing my knowledge about something I am passionate about. I have learned a lot from others in my Power BI journey. Speaking myself at this conference gave me an opportunity to pay it forward and help others. I would highly recommend you take this opportunity and apply to speak.
“The presentation and the feedback from the audience, was a testimony that my work was valuable! An amazing feeling!”

Paolo Damiani
Milan, Italy
Presentation: Using Power BI to Skillfully Navigate Company Transformation
❝I do not have deep technical skills in Power BI. Can I still add value to the Conference?❞
I do not consider myself having a high set of technical skills in the implementation of Power BI, hence was not sure of the value I could add to the conference.
When I delivered my message, I realized that there was indeed value in what I did with Power BI.
My work helped a big takeover to be successful. And the audience recognized that value. As Avi says, “It is not about technology (Power BI), it’s about what technology can do for the business”
“It is not about the technology, it’s about what technology can do for the business”

Susan Zwillinger
Pittsburgh, United States
Presentation: 6 Biomimicry Lessons for Marketing & Market Analytics Using Power BI
❝I have spoken with clients and small groups, but the idea of speaking to a larger group made me nervous!❞
Doubts? I had so many doubts when I applied to speak, where do I start?
My first worry was that my dashboard pages and data model would be too simple to be useful to the audience.
Speaking with clients and small groups has been easy for me, but the idea of speaking to a larger group of people made me very nervous. I was worried that my nerves would hinder me from communicating effectively.
I knew I would have some things to learn, and I worried that I wouldn't have time to adequately prepare..
Results! Before the conference, the speaker presentation training and prep sessions provided by Avi, were very helpful. They helped me create and deliver a presentation that really connected with the audience.
During the conference, Avi set the tone of the session and the audience were welcoming and supportive.
Even though my dashboards were simple, the conference community gave me encouragement before, during and after the presentation. It was a pleasure to connect with many of the attendees through LinkedIn after the conference.
Takeaway: After the conference, I realized that I had learned from all the speakers, not just those who did really well with public speaking. Even when things didn't go exactly as planned, the presentations were useful. It turns out that humans don't need perfection to learn from one another. I learned things that will help me serve my clients and build better dashboards.
“It turns out that humans don’t need perfection, to learn from one another.”
Details & FAQ
Speaker Application Deadline: Friday Aug 18, 2023
Conference Dates: Wed Sep 20 & Thu Sep 21, 2023
Q: I am concerned 🤔 about sharing my company’s sensitive data?
You can easily blur sensitive data when sharing your Power BI Dashboards. Just watch the video below.
Q: I am a first time speaker or only have limited speaking experience. Should I still apply?
If you fit our criteria above (Love Your Work / Live Your Life / Have a Story to Tell), then we strongly encourage you to apply to speak.
There would be help available for first time or new speakers, including training and prep sessions.
Q: What kind of content is a good fit for this conference? Can I see a sample presentation?
Most sessions showcase the story of a successful Power BI project.
You can see below a sample presentations from a past conference.
Q: Do you run other Online events?
Visit www.TalkPowerBI.com to get to know about all our upcoming events.
Power BI Data Modeling & Relationships Guide for Beginners
Data Modeling is perhaps the most important, but least understood concepts in Power BI.
But if you don't master Data Modeling and get it right, then everything else in Power BI becomes harder 🥵. But that's not going to be you, if you just watch the video below :-)
Click Play ▶ below 👇 to watch:
Why Data Modeling is Important in Power BI
Power BI is a powerful tool for data analysis and visualization, but at its core, it relies on a well-structured data model. Without a proper data model:
Performance issues arise due to inefficient queries. 🛑
Reports and dashboards may display incorrect or misleading data. 🚨
Complex calculations become difficult to implement and maintain. ❗
A good data model makes your Power BI reports faster, easier to maintain, and more accurate.
Understanding Data Modeling in Power BI
1. Flat Table vs. Star Schema
When designing a Power BI data model, you generally have two options:
Flat Table: Many users, especially ones coming from an Excel background, like to flatten everything to a single table, but that is a very dangerous approach and can lead to serious performance and maintenance issues.
Star Schema (Data Table & Lookup Table): A central Data Table (e.g., sales transactions) with supporting Lookup Tables (e.g., customers, products, dates). This is the recommended structure for Power BI as it optimizes performance and improves data organization.
2. Data Tables & Lookup Tables
Data Tables: Store transactional data (e.g., sales, revenue, expenses). These tables contain numerical values used in calculations.
Lookup Tables: Store descriptive information (e.g., customers, products, dates). These tables help categorize and filter data.
3. Importance of Relationships in Power BI
Relationships define how tables in a data model connect with each other. They ensure that data from different sources can be linked correctly.
One-to-Many Relationship: The most common type. A single record in one table (e.g., customer) relates to multiple records in another table (e.g., sales transactions).
Many-to-Many Relationship: Used when a direct one-to-many relationship is not possible. Recommended to be used with a bridge table.
One-to-One Relationship: Less common but useful for scenarios where data is uniquely mapped between two tables.
How to Create and Manage Relationships in Power BI
1. Using Power BI’s Model View
Navigate to the Model View to visualize table relationships.
Drag and drop fields between tables to create relationships.
Ensure that relationships follow best practices (e.g., avoiding many-to-many relationships when possible).
2. Managing Relationship Cardinality and Cross-Filter Direction
Cardinality: Defines the nature of the relationship (one-to-one, one-to-many, many-to-many).
Cross-Filter Direction: Determines how filters propagate between tables.
Single: Filters flow in one direction (recommended for performance optimization).
Both: Filters flow in both directions (use with caution as it can lead to performance issues).
3. Handling Common Relationship Issues
Inactive Relationships: Sometimes relationships are not automatically used. In such cases, DAX functions like
USERELATIONSHIP()can activate them.Circular References: Occur when relationships create loops. Resolving them requires restructuring the data model.
Ambiguous Relationships: Power BI may struggle to determine which relationship to use. Ensuring proper lookup and data table design prevents these issues.
Best Practices for Data Modeling in Power BI
Use a Lookup Table & Data Table Structure Instead of a Single Flat Table – Improves performance and scalability.
Reduce Unnecessary Columns – Only keep necessary data to improve performance.
Optimize Data Types – Use integers instead of text for IDs, and avoid excessive calculated columns.
Avoid Bi-Directional Relationships – Use single-direction relationships for better performance.
Leverage DAX Measures Instead of Calculated Columns – Measures are more efficient than storing additional data.
Use Date Table for Time Intelligence – Create a dedicated Date table to enable time-based analysis.
Final Thoughts
Mastering data modeling in Power BI is essential for building efficient and scalable reports. By understanding lookup tables, data tables, relationships, and best practices, you can create models that are easier to manage, perform better, and produce accurate insights.
Scroll up 👆 to watch the Full Video ▶️: Power BI Data Modeling Guide for Beginners.
If you want to take your Power BI skills further, consider joining our LearnPowerBI training program, where we take you from beginner to Power BI Pro in just 30 days!

DAX GUIDE: Top 5 DAX Functions to Master Power BI
There are hundreds of DAX Functions in Power BI 😱.
But you don't have to learn them all.
In all my experience working on client projects, I found myself using just these Top 5 DAX Functions most of the time.
And if you give me just a few minutes:
✔️ I will walk you through each one and...
✔️ Show you how to use them
Click Play ▶ below 👇 to watch:
🎁 FREE BONUS: Get My Ultimate Calendar Table 📅 and unlock the full power of DAX Time Intelligence.
Ready to go from a Beginner to Power BI Pro?
Video Covers the following topics:
Top 5 DAX Functions to Master Power BI
#5 SUM, COUNTROWS & A Bonus Function ➕
SUM Function
One of the most basic and widely used functions.
Adds up the values in a column.
Example:
TotalSales = SUM(Sales[Amount])
COUNTROWS Function
Counts the number of rows in a table.
Helpful for determining the number of transactions, products, or customers.
Example:
TotalOrders = COUNTROWS(Sales)
Bonus Function: DISTINCTCOUNT
Counts unique values in a column.
Ideal for counting unique customers or distinct product categories.
Example:
Unique Customers = DISTINCTCOUNT(Sales[CustomerID])
You’ll find yourself reaching for these often when working with aggregations in Power BI.
#4 CALCULATE 🔢
The CALCULATE function is considered the most powerful function in DAX because it allows you to modify the context in which your calculations happen.
Key Features:
Used to apply filters to existing measures.
Modifies filter context dynamically.
Works well with SUM, AVERAGE, COUNT, and other functions.
Example:
Find total sales where the region is "West":
TotalSalesWest = CALCULATE(SUM(Sales[Amount]), Sales[Region] = "West")
#3 X Functions: SUMX, MINX, MAXX etc. 🔄
Next, we dive into the world of X functions, including:
SUMX: Calculates the total revenue by multiplying quantity and price for each row before summing it all up.
MINX: Finds the minimum value row by row.
MAXX: Finds the maximum value row by row.
AVERAGEX: Averages an expression across a table.
The X functions work row by row in a table, applying a calculation to each row and then aggregating the results. They are your toolbox for custom calculations.
Example:
TotalRevenue = SUMX(Sales, Sales[Quantity] * Sales[UnitPrice])
Bonus: Mystery X Function 🔮: FILTER
Here’s a mystery function that deserves special mention:
FILTER: Filter should have been called FILTERX, because it is also an iterator function and operates row by row.
Why Use FILTER?
Allows you to apply complex filtering conditions to tables.
Essential for refining data within calculated columns and measures.
Example:
Filter sales data to include only transactions above 100:
FilteredSales = FILTER(Sales, Sales[Amount] > 100)
#2 ALL Function: Hammer & Chisel Versions ⚒️
The ALL function is like having a hammer and chisel for your data models
Types of ALL Functions:
ALL(Table) – Removes all filters from a table. This is the hammer 🔨 (see video for explanation)
ALL(Column) – Removes filters from a specific column. This is the chisel ⛏️ (see video for explanation).
This function is essential when:
You want to compare a specific value to the overall total.
You need to handle scenarios where filters might distort your calculations.
Example:
Calculate total sales, ignoring any filters on Product Table:
Total Sales AllProducts = CALCULATE(SUM(Sales[Amount]), ALL(Product))
#1 Time Intelligence Functions 📅
Time Intelligence functions are a game-changer in Power BI. These include:
TOTALYTD: Calculates year-to-date totals.
SAMEPERIODLASTYEAR: Compares this year’s performance to last year.
DATESMTD: Calculates month-to-date totals.
They let you perform calculations over specific periods. If your reports involve dates or time, these functions are a must-have in your arsenal.
Example:
YTD_Sales = TOTALYTD(SUM(Sales[Amount]), Sales[Date])
Conclusion
Mastering these five DAX functions will significantly improve your Power BI skills and enable you to create advanced analytical models. Whether it’s basic aggregation with SUM, dynamic filtering with CALCULATE, or time-based calculations, these functions will help you become a Power BI Expert.
Scroll up 👆 to watch the Full Video ▶️: Top 5 DAX Functions to Master Power BI and learn how & when to use each of these DAX functions.
If you want to take your Power BI skills further, consider joining our LearnPowerBI training program, where we take you from beginner to Power BI Pro in just 30 days!

Demystifying the DAX Filter Context in Power BI
As a Non-Techie myself, I was quite afraid of Power BI at the start. Okay, may be "afraid" isn't the right word. It was more like a mix of emotions…
I was excited 😃 , becasue I could see the amazing possibilities with Power BI
I was overwhelmed 😫, because I felt there was so much to learn and I knew so little
I was frustrated 😡, when I got stuck in Power BI even with seemingly simple things
But DAX Filter Context, yeah I was afraid 😱 of that :-)
Too late did I realize that:
❝Without understanding DAX Filter Context …You cannot really master DAX.
And without mastering DAX…You cannot truly master Power BI.❞
But you do not have to make the same mistake :-)
Just click below to watch my bonus training on DAX Filter Context.
Where I take this "complicated" concept and break it down so it's easy to understand.
Ready to go from a Beginner to Power BI Pro? Click to Learn How You Can Do it in Just 30 Days!
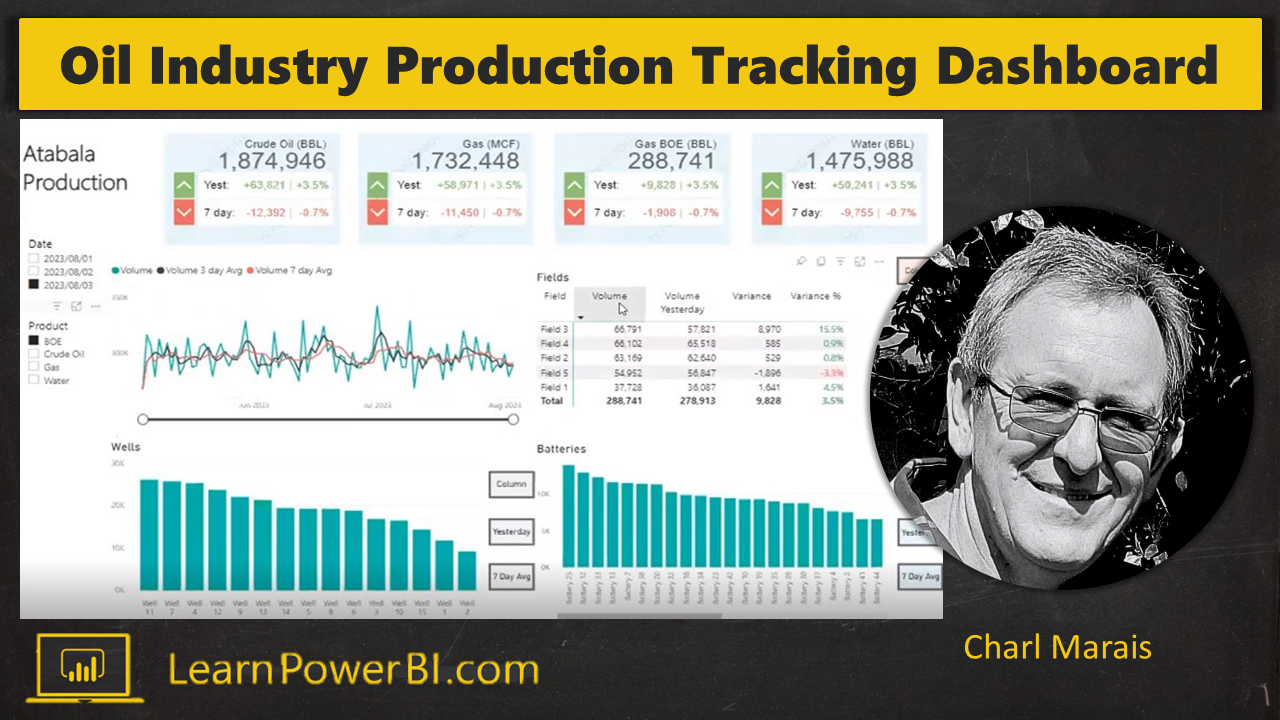
Power BI Dashboard: Oil Industry Production Tracking 📊 by Charl Marais
Join us in this inspiring video where Charl Marais shares his journey of creating a Power BI Dashboard 📊, for an oil production facility in Algeria. Despite facing numerous challenges, Charl's determination led to some remarkable results.
What You Will Learn from the Video:
How to Create an Oil Industry Power BI Dashboard: Learn how Charl built a comprehensive Power BI dashboard for a crude oil production facility in Algeria.
Overcoming Challenges: Discover the challenges Charl encountered during the project, including language barriers, limited data access, and power cuts, and how he managed to overcome them.
Effective Communication: Find out how Charl adapted his communication methods, including using WhatsApp, to bridge language gaps and maintain efficient collaboration with the client.
The Art of Saying No: Explore the importance of setting boundaries and knowing when to say no to client requests that may not align with project goals.
Focusing on the Positive: Learn how Charl's mindset and focus on the positive aspects of the project contributed to his success, even in the face of adversity.
Creating Value: Understand the value of extracting personal and professional growth from challenging situations and how this can benefit your career and business.
Power BI Training Programs: Charl mentions the significance of training programs for those looking to achieve success with Power BI. Explore the resources available for Power BI enthusiasts.
Internal Journey: Discover the connection between mastering your internal dialogue and achieving external success, and how it can lead to better results for both yourself and others.
Charl's journey is a testament to the power of determination, adaptability, and a positive mindset. Tune in to this video to gain valuable insights on navigating challenges and delivering outstanding results using Power BI.
Connect with Charl Marais on LinkedIn.
Ready to Build Your Own Power BI Dashboard? Join our LearnPowerBI Training Program and get your Dashboard 📊 built in 30-Days (Guaranteed!)
Power On!
Avi Singh | PowerBIPro


How to Showcase Your Accomplishments Using the LinkedIn “Featured Section”
Why is it Important to Showcase Your Accomplishments?
When you're part of online professional networks like LinkedIn, it's a good idea to share your successes.
This isn't about bragging, it's about showing who you are.
When you highlight things you've done well, like
Finishing a project
Winning an award
Speaking at an Event, etc.
It helps others see how skilled and dedicated you are. Sharing your achievements on your profile helps you make connections 🤝🏼 and might lead to new opportunities 🎯. It's like telling a story about what you're good at, and it can help you meet new people and do even more cool stuff 😎 in your career!
Using LinkedIn “Featured Section” to Showcase Your Accomplishments
Watch the video or read below, on how you can use the LinkedIn “Featured Section” to Showcase Your Accomplishments.
The Video Covers:
How to Add the "Featured Section" on Your LinkedIn Profile
Introducing the Featured Section and its significance.
How to seamlessly add the Featured Section to your LinkedIn profile.
Recognizing the prime real estate that the Featured Section occupies on your profile.
How to Feature a Post Using "Add a Link"
Steps to highlight a significant post by featuring it in the section.
Utilizing the "Add a Link" option to share a post that showcases your achievement.
The importance of customizing the title for maximum impact.
How to Feature a Video Using "Add a Link"
A guide to featuring videos that hold relevance for your profile visitors.
Utilizing the "Add a Link" feature to incorporate videos in the Featured Section.
The art of crafting descriptive titles to make your videos stand out.
How to Order Featured Items based on Importance
Why the order of featured items matters and how to arrange them.
Understanding the simple yet effective reordering process.
Tailoring the arrangement to showcase your achievements strategically.
Featured Section Showcases Your Achievements "Above the Fold"
Emphasizing the value of the "above the fold" real estate on your profile.
How the Featured Section serves as an immediate attention-grabber for profile visitors.
A spotlight on the opportunity to present your accomplishments prominently.
In this day and age, you can’t just do good work and hope to succeed 🤞. You need to do the good work, but then also share the story of your work with the world 🌍.
And now you can do that easily using the LinkedIn Featured Section.

What does My Life of Financial Freedom 💸 Look Like?
After giving up my high-paying job at Microsoft, I struggled for many years…
Before finding my path to freedom and fulfillment 💛.
Below is an honest account of what my life looks like. What I don’t have, and what I have.

My Mom
I don't have a mansion with a pool 🏊♂️, but I have my mom.
We felt like we had almost lost her in 2021. She suffered a severe health crisis. I rushed from USA to India ✈️, to be by her side. And thankfully she recovered.
When she was ill, I had resolved that I would spend at least two months in India each year.
But then she got better, and it wasn't *necessary* anymore.
But I realized, that now that she was healthy…it was more *important* than ever to spend time with her.
Wouldn't I rather spend time with her while she's still fit? When we can still go out for walks in the park? Go watch a movie together? Or just watch the sun set 🌅?
So I plan to continue to go to India for at least two months each year. Even spend four month, six months or longer if needed.
But here's the best part :-)
When I want to visit mom…There's no leave application to the boss, there's no manager approval.
I just book my tickets and go ✈. Because I work for myself.
After 15+ years in corporate America, I quit my job at Microsoft and started my own business. I struggled for a while, but eventually I was able to create a life of freedom and fulfillment 💛. I may not have a mansion with a pool, but it does let me spend as much time as I need with my mom.
Now I help others to follow their path to freedom 💸.
Click below to Learn More 👇

Hiking!
I don't have a luxury sports car, but I do have hiking in my life 🥾. I love the outdoors and I go hiking once every week - and on a weekday too!
I keep my work and meetings on Tuesdays and Thursdays. That means I have - Monday, Wednesday or Friday to pick from when planning my weekly hike.
And when you live in Seattle, that's really important :-) Because the weather is unpredictable and it rains a lot 🌧️.
So every Sunday, I check the weather forecast and whichever day has the best weather 🌞 (Mon/Wed/Fri), is the day I hike :-)
I have lived in the Northwest for 18+ years . But I feel like I've just discovered it in the past few years, since I started hiking. Hiking has shown me the beautiful outdoors 🌲🏔, but also helped me find myself in a way 😇.
It's been a gift. And I feel truly grateful.
But it wasn't always this way. For 15+ years I had a 9-to-5 Corporate Job 👨💼 which consumed my life. I barely had time 🕤 for myself or my family.
Finally I quit my job at Microsoft and started my own business. I struggled for a while, but eventually I was able to create a life of freedom and fulfillment. I may not have a luxury sports car, but I do get to hike every week 🥾 :-)
Now I help others to follow their path to freedom 💸.
Click below to Learn More 👇

My Health
I don't have money 💲 to burn 🔥, but I do have my health 💪. In fact, at 44 right now, I may be in the best shape of my life.
But it wasn't always like this. I spent 15+ years in corporate jobs.
And of course, I always knew that my health was important. But the *important*, often fell victim to the *urgent*.
There was always something going on at work that felt urgent 🔥. Some new project, re-orgs, layoffs, dealing with new manager or something else.
My work took up a *BIG* chunk of all time and life.
And the *important* things - like taking care of my health - often fell by the wayside.
Now my life is different.
> I work out twice a week in the gym with my daughter (she's my gym partner).
> On other days, I do cardio or meditation at home (for my physical and mental fitness)
> I have time to eat healthy (you often eat unhealthy when in a rush)
> And overall I am relaxed and away from the stress I had to deal with every single day
I don't have money 💲 to burn 🔥, but I do have my health 💪 :-)
Now I help others to follow their path to freedom 💸.
Click below to Learn More 👇

Time to Spend with My Kids
I don't have the money to party around the world 🥂, but I do have homework :-). Yes I love homework! Because my daughter and I 👨👧, often work together on her Math homework.
My life wasn't always like this. There was a time when I was so busy at work I could barely pull myself away for even big events like birthdays.
But now I have time ☺.
I have time to be around my kids. Drop them off and pick them up from school or classes. Talk to them when they are struggling a bit and offer to be their study buddy :-)
Now I do feel lucky that my daughter took me up on my offer. And it's been such a gift. I love the time we spend together doing homework 📝. Sometimes I help her with a tough problem, but many times she's the one who helps me. She explains the concept to me or corrects my mistakes.
I told friend about this, and I said, "I love 💛 these small moments. Because I think *parenting* is made of small moments like this".
To which they responded, "Not just parenting Avi, *life* is made-up of these small moments".
I just feel lucky and blessed that I'm able to enjoy and cherish these small moments of life.
How did I get here? I quit my job at Microsoft and started my own business. I struggled for a while, but eventually I was able to create a life of freedom and fulfillment 💛.
Now I help others to follow their path to freedom 💸.
Click below to Learn More 👇

Friendship + Adventure
I don't fly around the world in a private jet 🛩, but I did get to visit my friend in Kenya 🦓.
Robert lives in Kenya and we had met in the Power BI 📊 community. Right from our first conversation, I felt the synergy ⚡ between us. As if, both of us were dialed in to the same frequency.
Robert and I soon ended up working together in our company. As colleagues and friends, we spent hundreds of hours on zoom calls 💻. Sometimes talking about work, but quite often talking about life.
So it seemed a bit crazy 🤪 to fly all the way to Kenya to meet him.
And as I arrived in Kenya after a 22 hours flight, I was definitely questioning my decision.
But as soon as I stepped out of the airport and hugged Robert who was waiting there for me…I knew it was worth it.
The time I spent with Robert and with his loved ones…is a cherished memory beyond any value 💛.
Something like this, just wouldn't have been possible for me in my old life with a corporate job 👨💼.
Not just the money, the biggest reason was - I just wouldn't have the *time* 🕜.
Work consumed so much of my life, I barely had time for myself or my family. How could I make time to visit a friend in Kenya???
But thankfully my new life is different. I quit my job at Microsoft and started my own business. I struggled for a while, but eventually I was able to create a life of freedom and fulfillment. I don't fly around the world in a private jet, but I did get to visit my friend in Kenya 💛 .
Now I help others to follow their path to freedom 💸.
Click below to Learn More 👇

How To Sell / Get Clients, If You’re Not Good at Selling
❝ I wanna be a consultant but…
I'm not good at selling/I'm afraid of selling ❞
This is one of the biggest objections or fears, that I hear about pursuing the path of becoming a consultant and creating a life of freedom 💸.
And hey I totally get it, I'm afraid of selling too 😊
But then how was I able to set up a successful business and create a life of freedom that I couldn't have imagined…
Without Selling?
The Worst Way to Sell…
As it turns out, “selling” is the worst way to sell in this time and age.
Think about it, think about your own life, your interactions with the outside world…
We are inundated 🌊 by sales messages 💲💲💲.
They show up on a phone scrolling through family photos
Follow us on websites like a pervy stalker
They spam our inboxes in e-mail or LinkedIn messages
They're annoying 😡 aren't they?
We don't like them, and we have gotten pretty good at ignoring them.
That's the age we live in.
Now if you think about it, if we feel annoyed by these messages and ignore most of them…
Why do Companies still Pour Billions of Dollars 💲💲💲 in Selling?
A Nigerian Prince 🤴 Wants to Send You Money
You know that scam e-mail where a Prince in Nigeria wants to send you some money so you can keep it safe for him?
It's ridiculous, right?
But then why do scammers still keep sending that e-mail?
Because it works!!!
It works for a very small percentage. But that’s all they need.
And that's how this game is played.
The game of selling (or scamming) now works at scale.
Either you are a big player or you're a nobody.
But the challenge is, how can you and I - the small time Power BI Consultant / Freedom-preneuer…
How can we compete at this game with the big players? We can't win that game!
What do you do when you are faced with an Unwinnable Game?
You change the game.
The Best Way to Sell…
The best way to sell in this day and age, is not to sell.
Instead of selling/scamming people…
What if we acted as humans?
What if we genuinely cared about people?
What if we were genuinely interested in solving their problems and helping them?
What if we had real conversations with people?
What if instead of sending spammy messages, we talked to them like we would if we met in person?
What if instead of selling them our products or services…
We first listened.
What if we first understood their problems and cared about solving them?
What if we cared more about helping people and companies and only next about making money 💲💲💲?
And as it turns out, this #Backwards way, this extremely #Simple way…
Is a great way to not only earn good money, but also create your life of freedom 💸.
The best way to sell in this day and age, is *not* to sell.
The best way to sell is to be human and care for other human beings.
And trust me, you already know this, and are very good at it 😊. You just needed a reminder.
So go out there and start “selling” without ever selling; and create that life of freedom 💸.

Getting Ready for the New Year? Now is the Time to Set Your #TrueGoal
What's the right time to plan your next week? 🤔 I dunno, Friday?
What's the right time to plan your next year...that's definitely December 🥳!
I'll admit my days and weeks are sometimes more chaos than order. That's been a downside of being an Entrepreneur, your own boss.
The downside is - there is no boss telling you what you need to do 😃
So sometimes I wake up and I have no idea, what I should do today? (Or not do, and just goof off!).
But it still all seems to work out quite well in the end, perhaps because...
I have the annual planning nailed 🎯
Like I'm completely fabulous at it :-)
Oh well, I have found a system that works for me. Happy to share it with you; feel free to copy or adapt as you wish.
Plan Your Breakthrough Year: Setting Your Goal
Goals are important.
But what has NEVER really worked for me are…
❌ S.M.A.R.T. Goals ❌
I don't like SMART goals. They just have never worked for me. (If they work for you, great, you can stop reading now :-))
But if you've struggled with SMART Goals, here is my alternative.
✔️ T.R.U.E. Goals ✔️
Which is an acronym for...just kidding 🙂, it's not an acronym.
Just..."True Goal".
Yup that's it.
❝Okay Avi, what the heck is a True Goal?❞
Ah...for that let's step into the time machine and go back to when I turned 40.
For some folks turning 40 is not a big deal at all. For me, it was a huge navel gazing 👀 event.
I really started questioning my life.
What had I done so far?
What did I want the rest of my life to be about?
I realized that in some way or form, all my life I had been chasing money 🤑.
Now I was a kid who grew up in the dusty streets of India.
My first job had a salary of whopping $3000 per year (yup per year).
Hitting my 40, I was making, what I would have considered at some point of time - an obscene amount of money 💲💲💲.
But it didn't feel enough. It never felt enough.
But now I was just tired of chasing.
And I could see, that if I didn't stop, I would be chasing this the rest of my life.
And still not get to the land of "Enough".
I no longer felt like I had "The Answer" to life.
But when you are lost, is when you can be rescued.
When you don't have the answer anymore, is when you can ask new questions.
So I asked a simple one:
❝If I did have ALL THE MONEY IN THE WORLD,
What kind of life would I like to live?❞
And I wrote down the answer. My True Goal.
Money is just a means to an end. But when we fixate on money, we forget our true goal.
And this is the first and the most crucial step in planning your best next year.
Are you ready to set your true goal?
How to Set Your True Goal?
Just ask yourself the question:
What would you want your life be like,
if you had all the money in the world?
Here's the catch ⚾
Do not to focus on things, but feelings. If things come up in your answer, that's okay. Write them down. But go one level deeper.
Example 1: "If I had all the money in the world I would buy a Red Ferrari 🏎️"
Great, I'm happy for you.
But if you buy the Red Ferrari…how would that make you feel? What would that give you, that's missing now?
Perhaps a sense of accomplishment?
Then chase that feeling. Make that your true goal.
Example 2: "If I had all the money in the world, I would live on a private island in Hawaii 🌴".
Again, really happy for you.
But if you do live on that island…how would that make you feel? What would that give you, that's missing now?
Perhaps a sense of peace or freedom?
Then chase that feeling. Make that your true goal.
The Shocking Truth about True Goals…
There is something ⚡shocking⚡ that I discovered, once I set my True Goal (or may be it is obvious) …
I found out, you actually DON'T need all the money in the world to get there😃.
In fact, the true goal is often much (MUCH!) closer and achievable than the money goal 🤑 I had been chasing.
So what was my "True Goal" and how did I get there?
You can read about that here.
⚡Power On!⚡
Avi / PowerBIPro

When Is It Time to Put Down Our Phones? My "Narnia" Moment in Hawaii 🌴
In the movie Narnia, you could step into a wardrobe and step out to a magical world.
Snorkeling 🤿 has always felt the same to me. As soon as you dip your head below the water, you are transported to a magical world. Filled with colorful coral, exotic fish and a few surprises.
There are few better places to experience snorkeling, than the picturesque beaches of Hawaii. On a recent trip to Kauai (Hawaii), we snorkeled at the Lydgate beach, Poipu beach, Salt Pond Park and Tunnels beach. We swam through the underwater forest of corals and exotic fish including the official state fish of Hawaii - Humu-humu-nuku-nuku-apua'a 🐟.
I took my underwater camera 📸 with me to most places. Now, photos can’t quite do justice to what you see with your eyes (uh, especially with my novice camera skills). But see the photo as a sample.
Our best snorkeling experience was at Anini beach. However I have no photos to share from Anini beach, because I had left my camera behind ☹️. When I first realized this at the beach, I was pretty cross with myself (how was I to “capture” the moment without my camera). But as it turned out, leaving the camera behind was a good thing.
Anini Beach
As we stepped on the soft sand of Anini beach, we could see and hear the snorkelers talking and pointing quite excitedly. And as soon as we stepped into the water and started swimming out, we realized why. There were lots and lots of sea turtles 🐢 in the water. They languidly fed on the sea grass, not caring much about the excited snorkelers.
We stayed with the crowd for a bit, but then we swam further out, towards the coral wall (about a 100 yards offshore). We swam along the corals, and spotted plenty of tropical fishes and also a few stingrays.
But as we were about to make our way back, we ran into a lone turtle, swimming all by itself. That is until my daughter decided to join it! And the turtle didn’t seem to mind.
The turtle swam lazily around with not a worry to be found. It would bob at the surface, then leisurely dive down. Nibble at the sea grass, weave through the corals and then just roll around.
And my daughter matched it stroke for stroke.
As they swam in perfect synchrony, the real world seemed to disappear for me. As if I had stepped into the Narnia wardrobe and stepped onto a magical world. I couldn’t tell anymore who was the turtle, and who was my daughter. The turtle became my daughter, and my daughter became the turtle. I became the sea, and the sea became me.
When is it time to put technology away?
I believe I could only experience that moment at Anini beach, because I had left my camera behind.
Without the technology, I could truly “capture” the moment, by fully experiencing it.
Sometimes that's just what we need. Not just on vacation but even in life & work. So the next time you're sitting down with a friend or a client/colleague; put your laptop away and put your phone down. And just be with them, in that moment.
Power BI Feature Request: Larger Icons for Selecting Chart Types

Power BI Visuals are awesome!
I love all the basic ones, they should be the staple of any Power BI Dashboard
Line Chart
Bar/Column Chart
Text Based: Table, Matrix, Card, Multi-Row Card
Then of course, there all these other cool ones 😎: Treemap, Ribbon Chart, Gauge and lots more. (Just be careful you know when and how to use them correctly. Don’t use them just for the coolness factor).
Finally you have lot more options for Custom Visuals, by clicking “Get More Visuals”.

We love Excel, don’t we! yup, we do.
And we love that Excel + Power BI = Great Together! And that is not a co-incidence. Excel and Power BI teams have a long history of collaboration.
And this may be one place, where Power BI can borrow some tried-and-tested goodness from Excel.
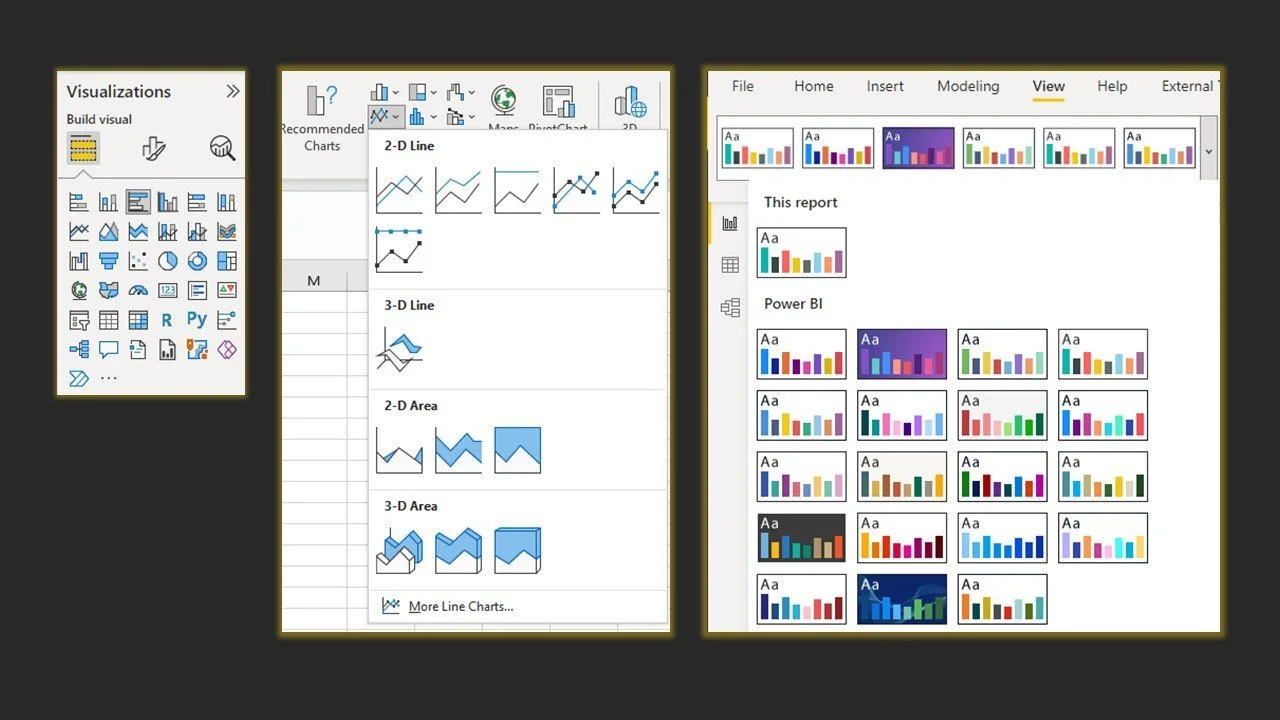
The Chart Selector Icons in Excel Ribbon are Much Larger and Easier to Use.
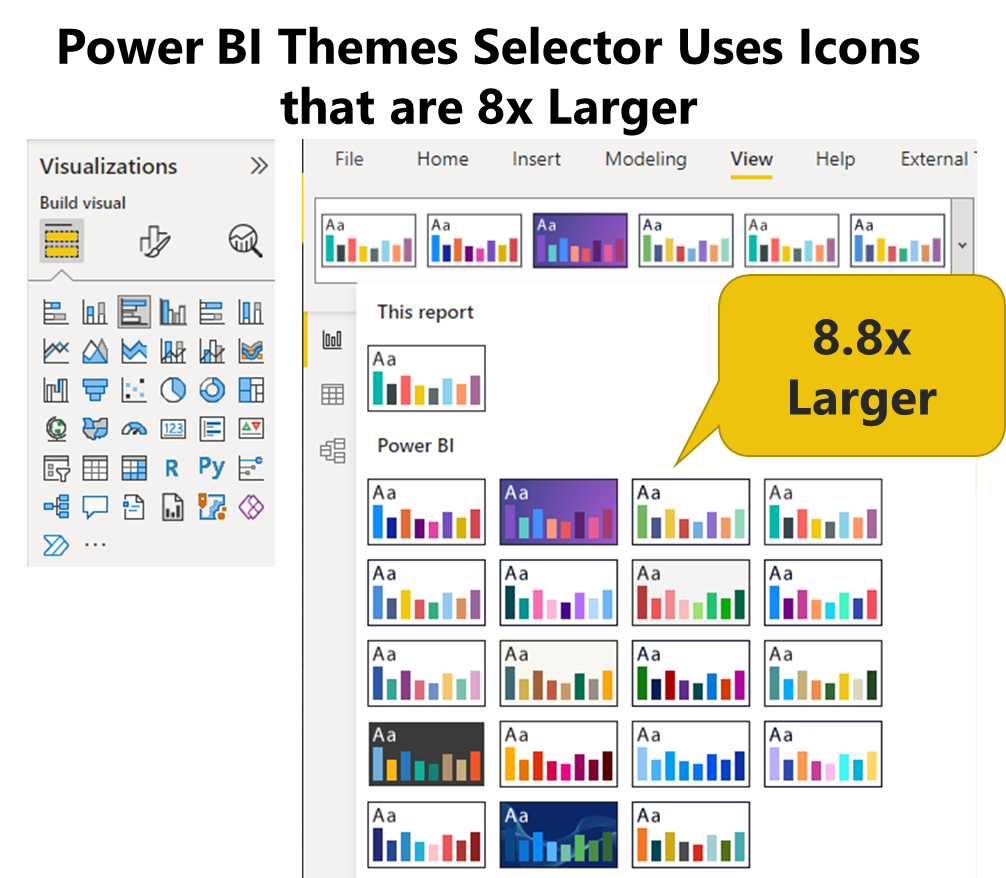
In fact, I feel there is one place where Power BI has already borrowed from the Office/Excel Ribbon interface. The gorgeous “Themes Selector”. With large, easy to see and use icons.
Vote for Idea: Large Chart Type Icons in Power BI
May be you have had the same struggle as me.
Or may be, after reading all this, you just want to help a guy out :-)
Either way, I would really appreciate if you clicked the link below and cast a vote for this idea: